Introduction
An introduction into the cgp.
# sphinx_gallery_thumbnail_number = 5
from __future__ import print_function, division


import numpy
import scipy

# skimage
import skimage.filters       # filters
import skimage.segmentation  # Superpixels
import skimage.data          # Data
import skimage.color         # rgb2Gray

# pylab
import pylab                # Plotting
import matplotlib

# increase default figure size
a,b = pylab.rcParams['figure.figsize']
pylab.rcParams['figure.figsize'] = 2.0*a, 2.0*b


import sys; sys.path.append("/home/tbeier/bld/nifty/python/")
# nifty
import nifty
import nifty.cgp

cellNames = ['Junctions','Edges','Regions']
Load image and compute over-segmentation
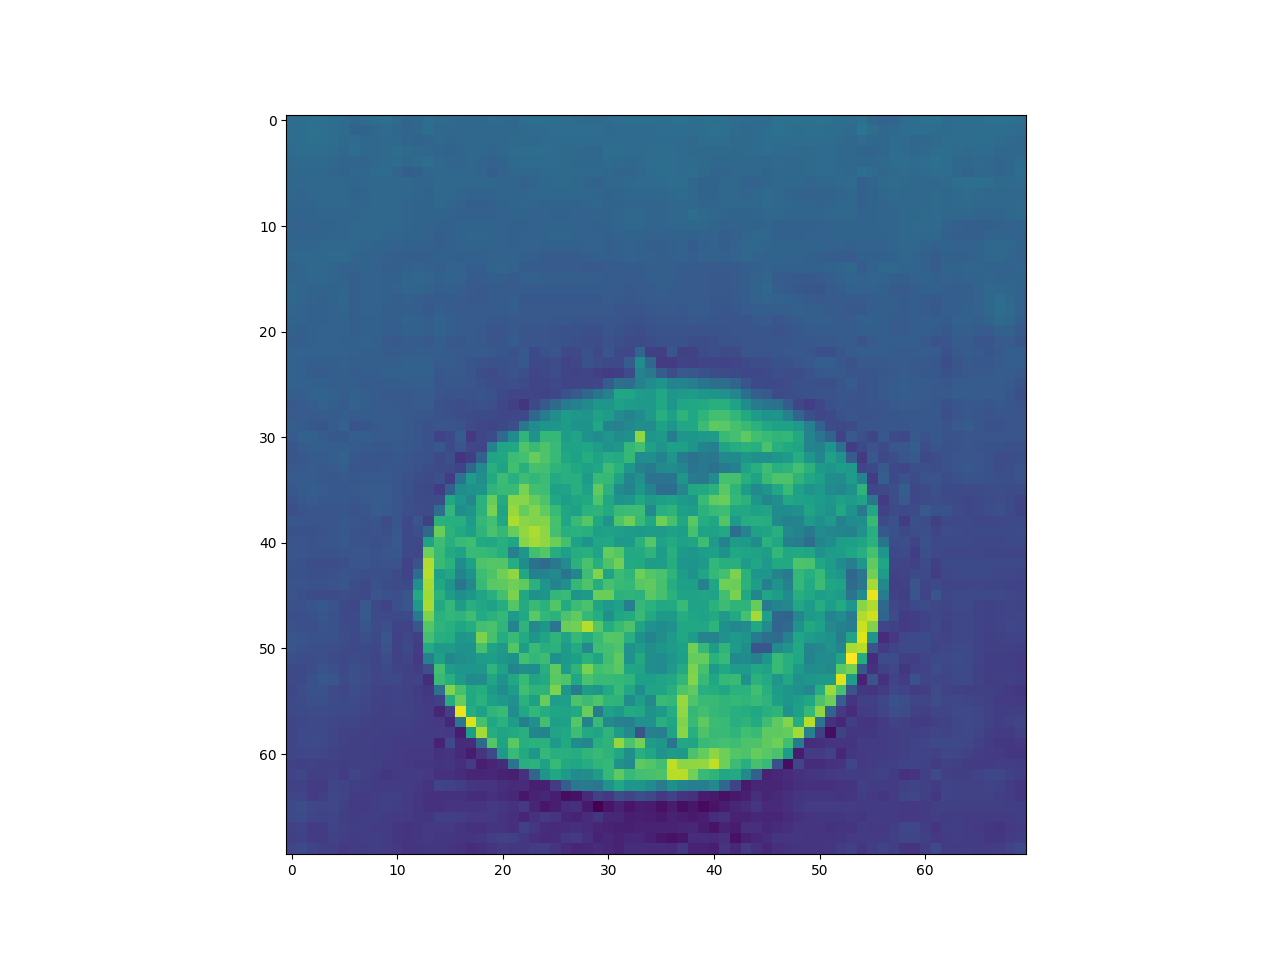
img = skimage.data.coins()[10:80,10:80].astype('float32')/255
pylab.imshow(img)
pylab.show()

# img is a gray value image
# to use it as a rgb img we just
# repeat the gray value
imgRGB = numpy.concatenate([img[...,None]]*3,axis=2)
Superpixels
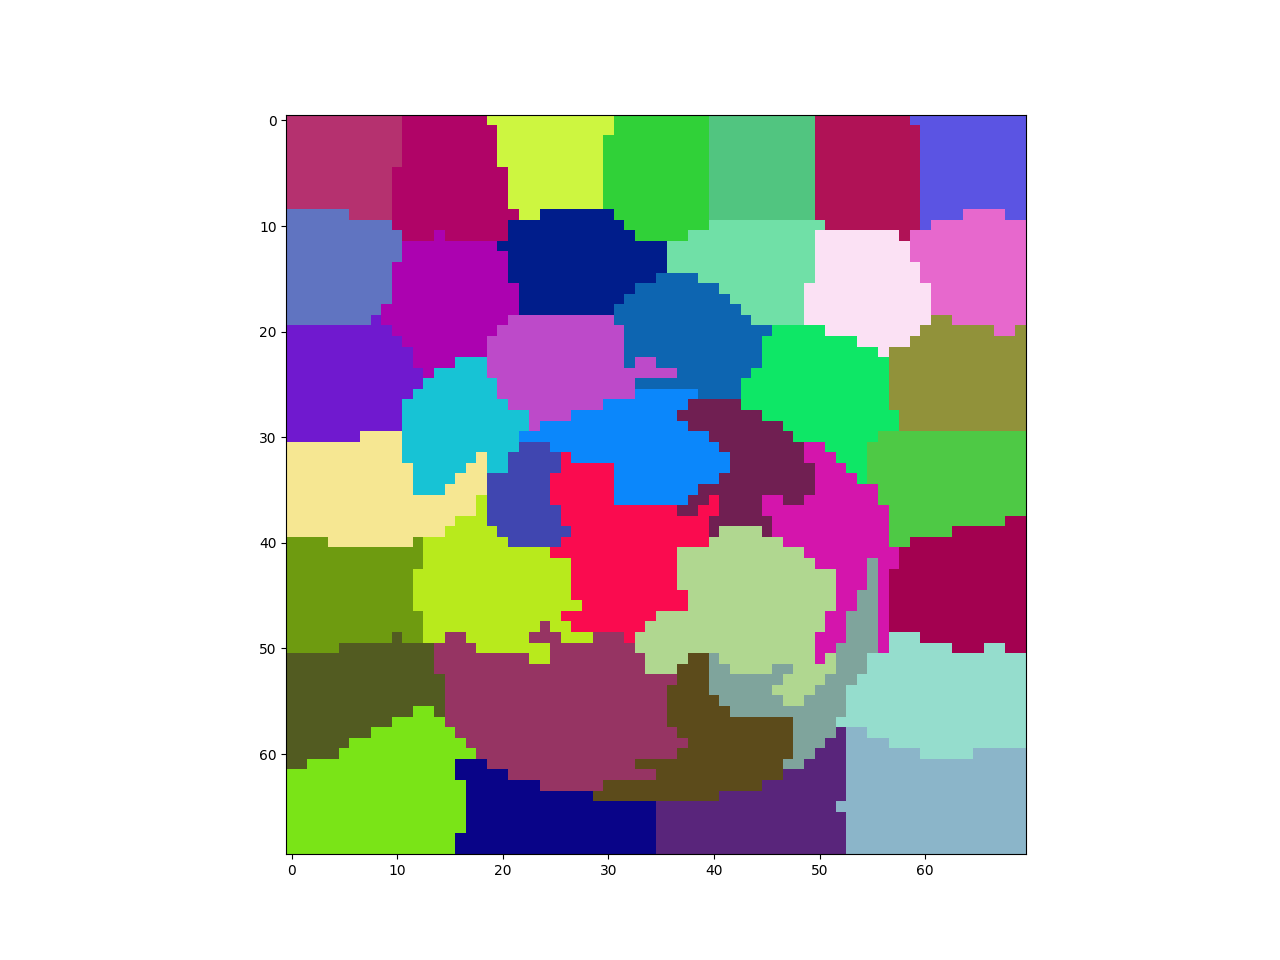
overseg = skimage.segmentation.slic(img, n_segments=50,
    compactness=0.04, sigma=1)
# let overseg start from 1
overseg += 1
assert overseg.min() == 1
cmap = numpy.random.rand ( overseg.max()+1,3)
cmap = matplotlib.colors.ListedColormap(cmap)
pylab.imshow(overseg, cmap=cmap)
pylab.show()
Compute cgp / topological grid
tgrid = nifty.cgp.TopologicalGrid2D(overseg)
Get the geometry of the cell-complex
cellGeometry = tgrid.extractCellsGeometry()


cell0Geomtry = cellGeometry[0]
cell1Geomtry = cellGeometry[1]
cell2Geomtry = cellGeometry[2]

# coordinates of some specific 1 cell
cell1Index = tgrid.numberOfCells[1]//2
coordinates  = cell1Geomtry[cell1Index]

# cast coordinates to numpy array
coordinates  = numpy.array(coordinates)

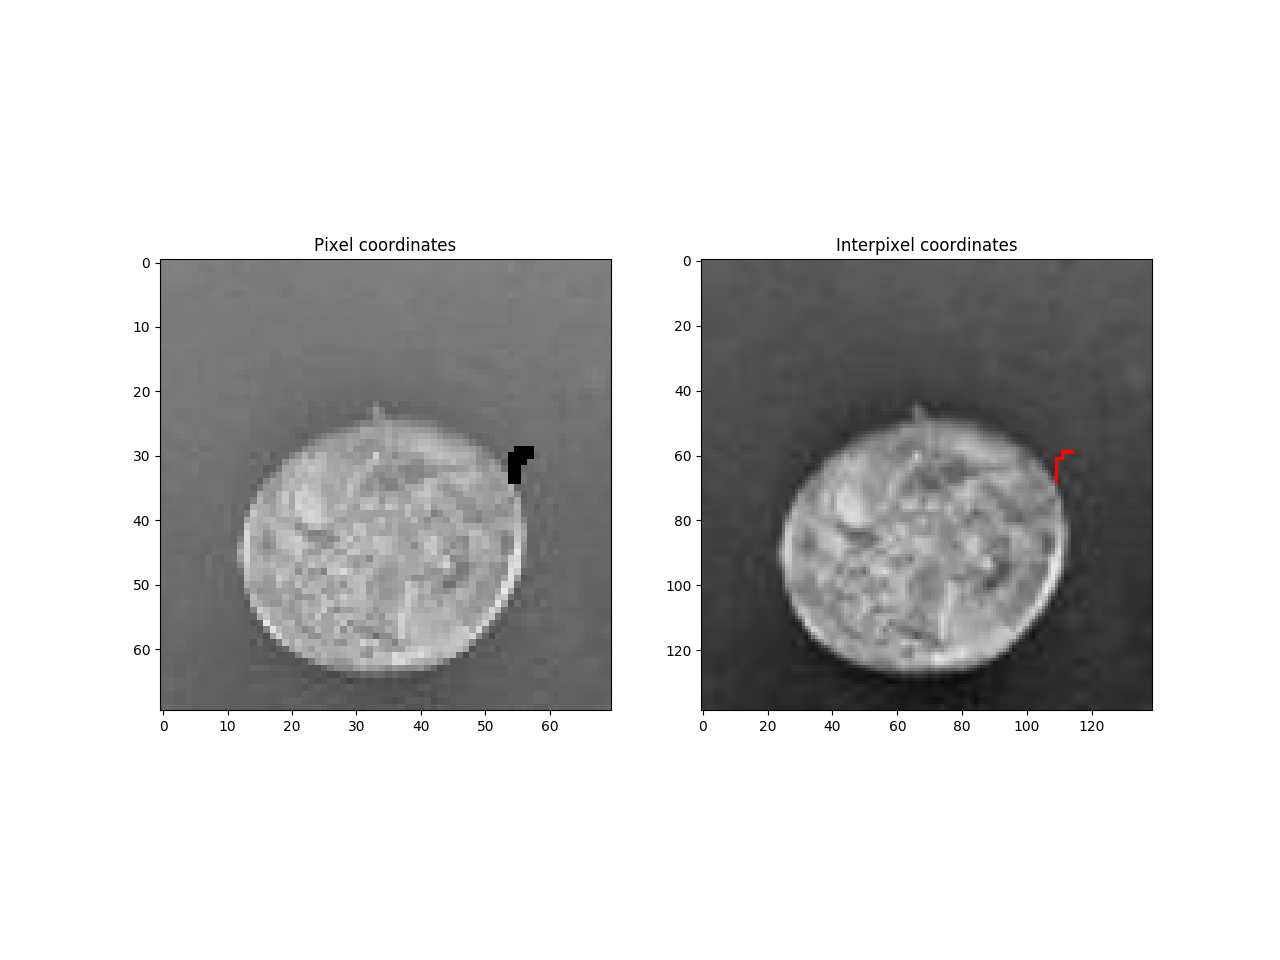
# the coordinates are interpixel-coordinates
# to convert them to normal pixels
# we need divide them by 2
# This will lead to non integer coordinates.
# Floor and ceil will lead to integer coordinates
cCoords = numpy.ceil(coordinates/2).astype('uint32')
fCoords = numpy.floor(coordinates/2).astype('uint32')
coords = numpy.concatenate([cCoords,fCoords], axis=0)

# write into image
pixelImg = imgRGB.copy()
pixelImg[coords[:,0], coords[:,1]  ,:] = 255,0,0


# we can also use the
# interpixel-coordinates directly
topologicalGridShape = tgrid.topologicalGridShape
print("shape",tgrid.shape, "topologicalGridShape",topologicalGridShape)
interPixelImg = scipy.misc.imresize(imgRGB, topologicalGridShape)
interPixelImg[coordinates[:,0], coordinates[:,1],:] = 255,0,0

f = pylab.figure()
f.add_subplot(1, 2, 1)
pylab.imshow(pixelImg,cmap='gray')
pylab.title('Pixel coordinates')
f.add_subplot(1, 2, 2)
pylab.imshow(interPixelImg,cmap='gray')
pylab.title('Interpixel coordinates')
pylab.show()
Out:
shape [70, 70] topologicalGridShape [139, 139]
get the bounds and bounded by relations
cellBounds = tgrid.extractCellsBounds()

# this gives you the boundaries (1-cells)
# of a certain junction (0-cell)
cell0Bounds = cellBounds[0]

# this will give us the junctions (0-cells)
# of a certain boundary (1-cell)
cell1BoundedBy = cell0Bounds.reverseMapping()

# get the labels junctions of a particular
# boundary (1-cel)
# Important: Labels start at 1, indexes
# start at 0.
# Bounds/ bounded by returns labels!.
cell0Labels = cell1BoundedBy[cell1Index]
cell0Indices = numpy.array(cell0Labels) - 1


for cell0Index in cell0Indices:


    # iterate over the boundaries of this junction
    cell1Labels = cell0Bounds[cell0Index]
    otherCell1Indices = numpy.array(cell1Labels) - 1

    for otherCell1Index in otherCell1Indices:
        if otherCell1Index != cell1Index:


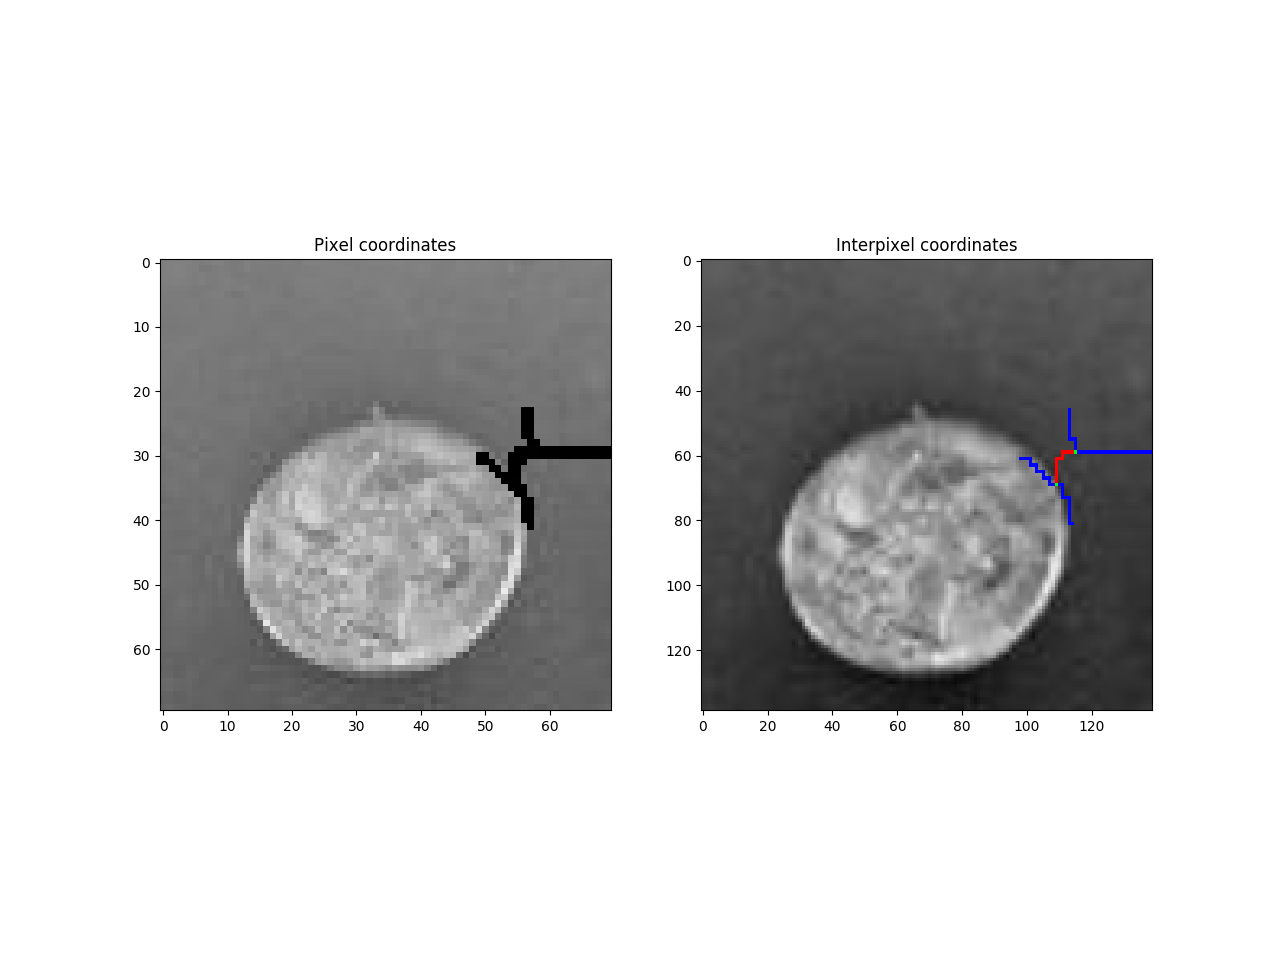
            coords  = numpy.array(cell1Geomtry[otherCell1Index])
            interPixelImg[coords[:,0], coords[:,1]  ,:] = 0,0,255
            cCoords = numpy.ceil(coords/2).astype('uint32')
            fCoords = numpy.floor(coords/2).astype('uint32')
            coords = numpy.concatenate([cCoords,fCoords], axis=0)
            pixelImg[coords[:,0], coords[:,1]  ,:] = 0,0,255


    # junctions only have a single coordinate
    # in supixels coordinates
    coord = cell0Geomtry[cell0Index][0]
    interPixelImg[coord[0], coord[1], :] = (0,255,0)

    # in the image, this are 4 pixels
    pixelImg[coord[0]//2, coord[1]//2, :] = (0,255,0)
    pixelImg[coord[0]//2, coord[1]//2+1, :] = (0,255,0)
    pixelImg[coord[0]//2+1, coord[1]//2, :] = (0,255,0)
    pixelImg[coord[0]//2+1, coord[1]//2+1, :] = (0,255,0)


f = pylab.figure()
f.add_subplot(1, 2, 1)
pylab.imshow(pixelImg,cmap='gray')
pylab.title('Pixel coordinates')
f.add_subplot(1, 2, 2)
pylab.imshow(interPixelImg,cmap='gray')
pylab.title('Interpixel coordinates')
pylab.show()
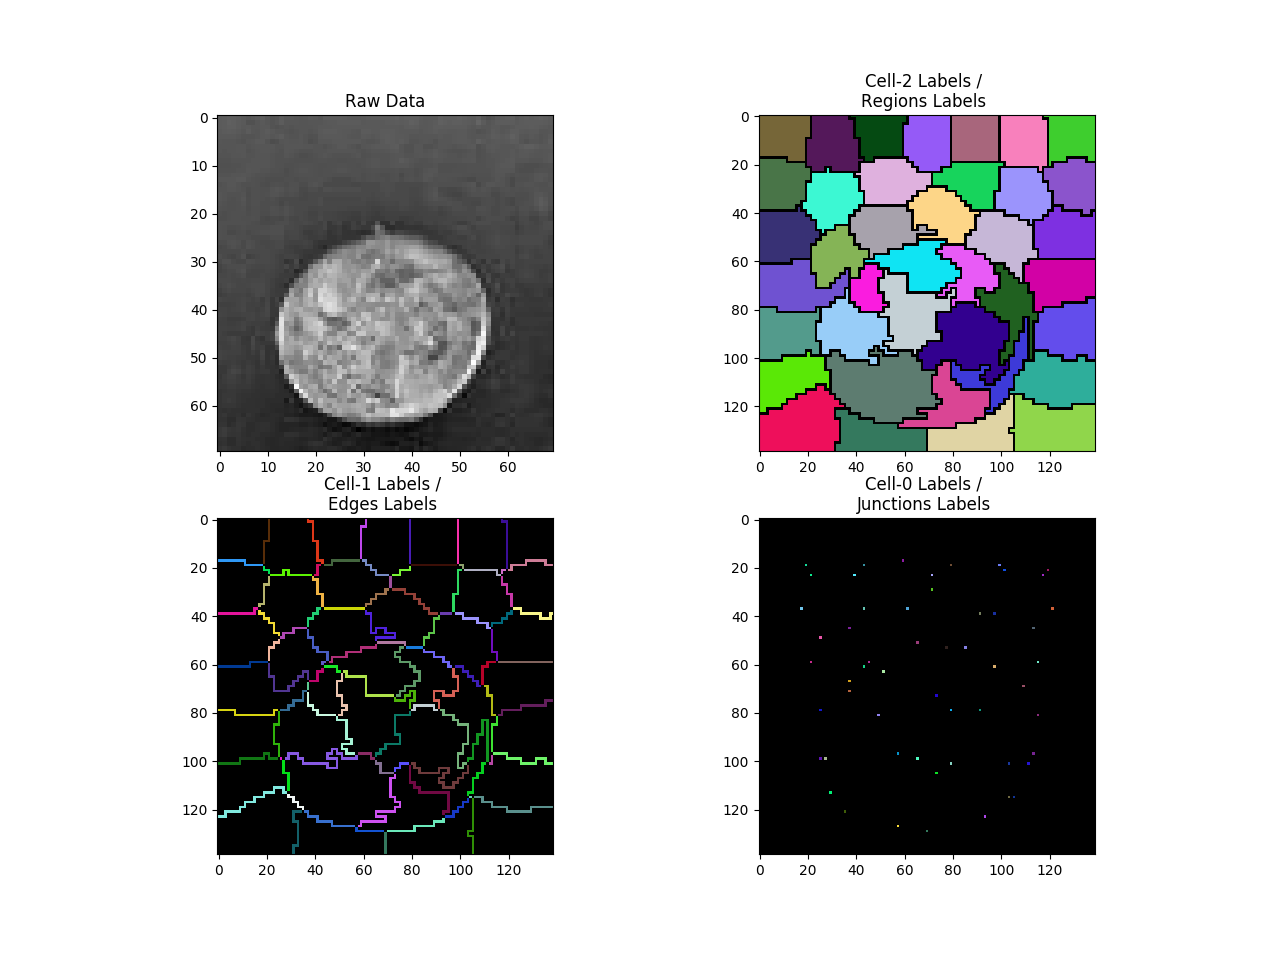
Show all cells labels at once
ftgrid = nifty.cgp.FilledTopologicalGrid2D(tgrid)
f = pylab.figure()

f.add_subplot(2, 2, 1)
pylab.imshow(img,cmap='gray')
pylab.title('Raw Data')
cmap = numpy.random.rand ( 100000,3)
cmap[0,:] = 0
cmap = matplotlib.colors.ListedColormap(cmap)
for i,cellType in enumerate((2,1,0)):
    showCells = [False,False,False]
    showCells[cellType] = True
    cellMask = ftgrid.cellMask(showCells)
    cellMask[cellMask!=0] -=  ftgrid.cellTypeOffset[cellType]

    f.add_subplot(2, 2, i+2)
    pylab.imshow(cellMask,cmap=cmap)
    pylab.title('Cell-%d Labels / \n%s Labels '%(cellType,cellNames[cellType] )  )
pylab.show()
Total running time of the script: ( 0 minutes 0.463 seconds)